


When a point is emitting unpolarized and homogeneous undulations equally in all directions, its state may be defined by two numbers; as, for instance by the wavelength of the undulations and their amplitude at a certain distance from the point. If the light is not homogeneous, indefinitely more numbers will be required to define it. But when a point upon the retina is illuminated, just three numbers are in every case requisite to define the sensation produced. In other words, light is a triple sensation. Charles Sanders Peirce 1878
A new dimension of colour
Why does a painting by Mark Rothko look different in natural day light and in artificial light? This question can’t be answered physiologically as our eyes perceive colours in a very simplified way adding the impression of our three colour sensors - or to speak with Charles Sanders Peirce: light appears to our eyey as "a triple sensation".
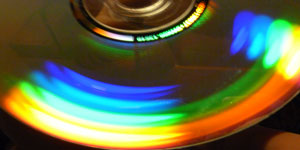 Spectral revision focuses the fact that colour is much more complex applying very simple means: If you send a beam of coloured light through a prism the light is dispersed into its constituent colours. But also the surface of a DVD with its very thin lines shows a similar effect. Here everybody can make a remarkable observation mirroring the light of a fluorescent lamp in the DVD surface: The resulting spectrum appears not continues but in discrete bands.A similar discovery was made yet 200 years ago by Joseph Fraunhofer (1787–1826) observing sun light with high grade glass prism. The observations revealed that the spectrum not only changes in the light intensity but it is also interrupted by black gaps. Graphically spectra can be represented as a curve like light intensity plot.
Spectral Revision
 As an immediate physical effect, spectra challenge our concepts of image and visualization. Art has often referred to light dispersed into its spectral rainbow colours. But interestingly spectra as a non-continuous colour phenomenon interrupted by "black gaps" or appearing as discrete color bands has never been the core of an artistic reflection.
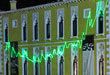
Yet the project From the Distant Past explored artistically the phenomenon of spectra translating the oldest colours in the universe recorded by the Hubble Space Telescope into a green animated laser curve projected to public facades in Venice, Baltimore and New York.
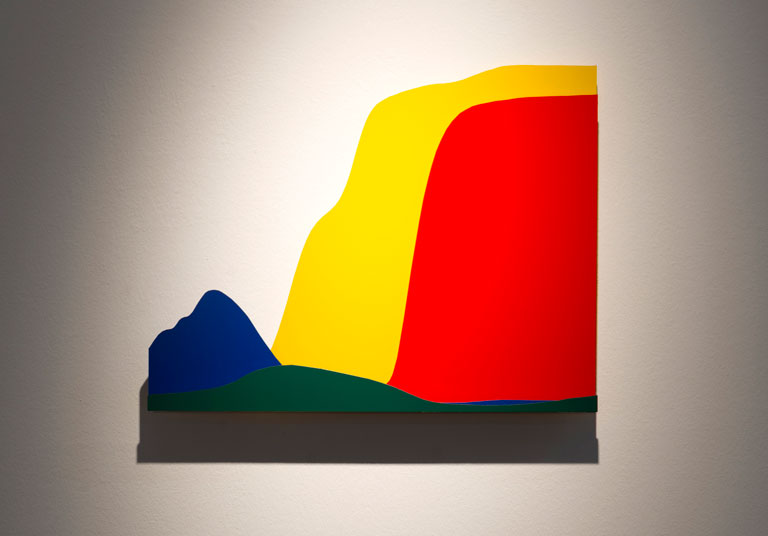
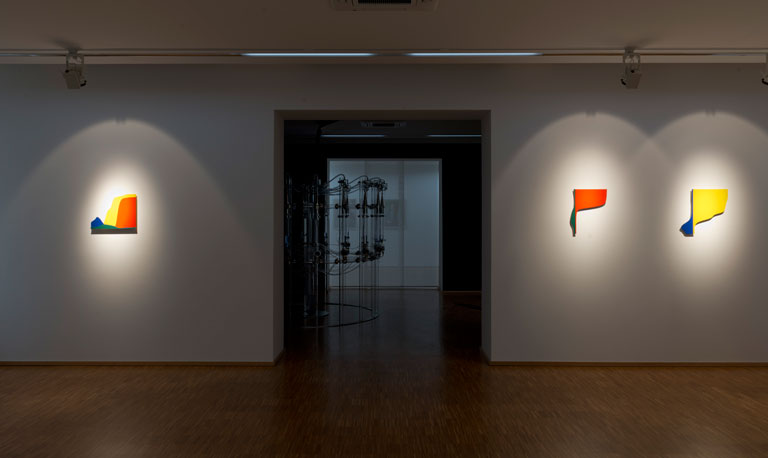
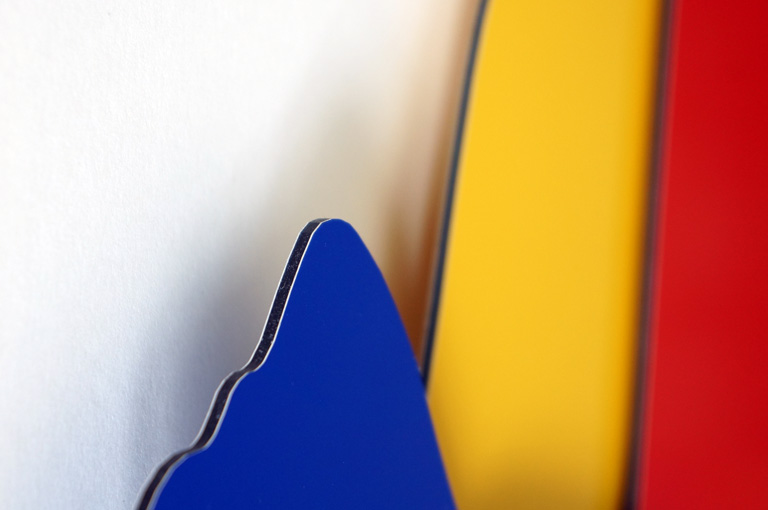
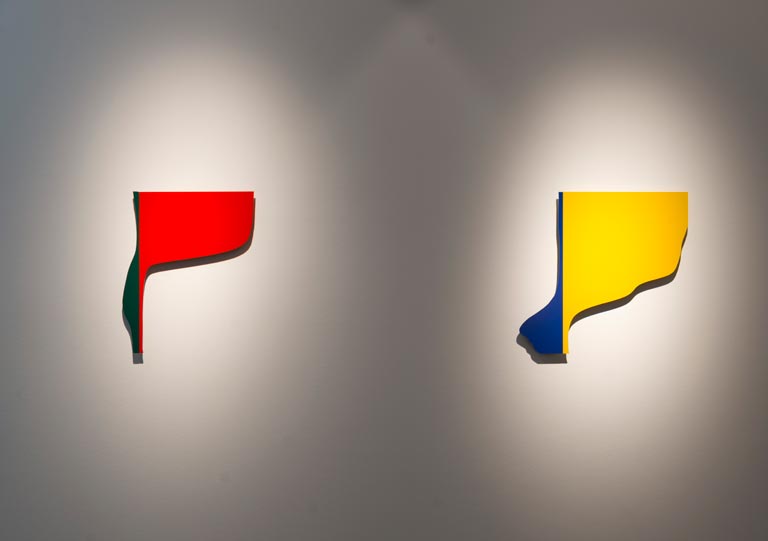
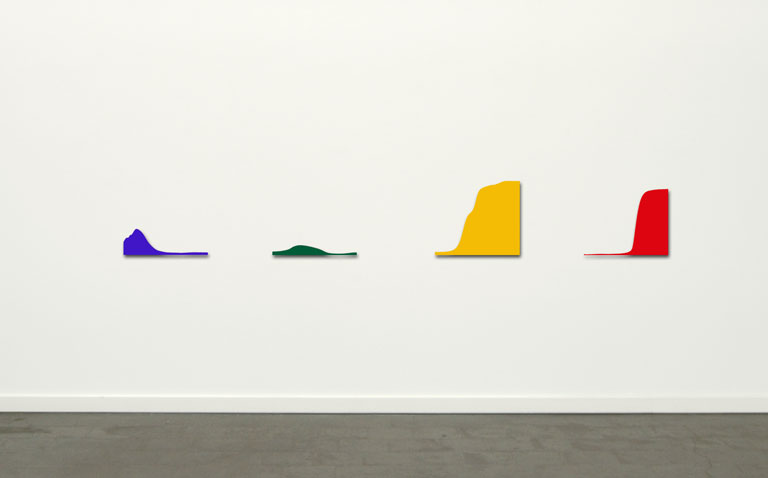
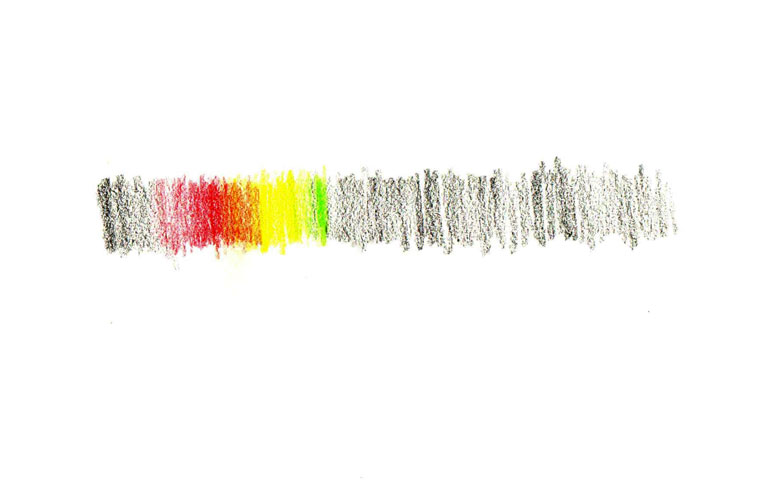 Spectral Revision puts a new accent to the tradition how the arts dealt with colour. It is a conceptual reflection of the phenomenon of colour not translated into words but literally translated into a spectrum by the means of spectroscopy. The spectral characteristics of existing paintings or light art is explored. For instance the artist used in the F40T12 series a hand spectrometer and colour pencils to translate the colours of a fluorescent light installation by Dan Flavin into drawings. But also new works are created: In the Dibond Series industrial coloured Alu Dibond plates are used as a kind of ready made colour canvas. In collaboration with the spectroscopist Dr. Bob Fosbury the four standard colours were analyzed with a spectrometer and finally the resulting light intensity curves were cut out the material by a CNC machine. The resulting curves are presented individually or as a kind of colour landscape composite.
Exhibitions:
February - May 2016 XX oder der 'Mummelsee in der Pfanne', solo show, Städtische Galerie, Offenburg
November 2016 - January 2017 Light From the Other Side, solo show, gallery of the Goethe Institute, Washington D.C.
related works:
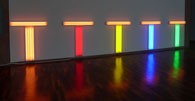 Spectral Revision, F40T12 series
colour pencil drawings on paper, 28x20 cm
2013
.
 The spectral curves for the Dibond series are based on the measurements made by Bob Fosbury in his laboratory. Watch his extended spectrosopy collection on flickr.